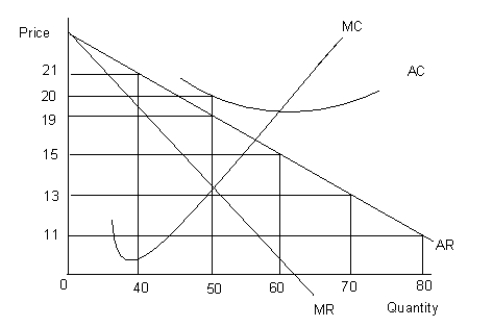
The figure given below shows the revenue and cost curves of a firm. MC represents the marginal cost curve, AC the average cost curve, MR the marginal revenue curve, and AR the average revenue curve.Figure 9.4

-Monopoly is a market structure in which:
Definitions:
Break Even
The point at which total revenues equal total costs, resulting in neither profit nor loss.
Variable Costs
Costs that change in proportion to the level of activity or volume of production in a business.
Capacity Alternatives
Different options or strategies a business may consider to adjust or increase its capacity to meet demand.
Market Acceptance
The degree to which a new product, service, or business model is embraced by potential customers and the market at large.
Q3: Which of the following is a possible
Q15: What causes the market supply curve to
Q18: The free rider problem occurs because:<br>A)it is
Q49: If a monopolist is producing at the
Q60: If the demand for product R increases
Q74: Refer to Figure 9.5. Identify the market
Q81: Refer to Table 7.4. What is the
Q106: In the short run, a firm continues
Q110: One of the popular myths about monopoly
Q135: Consumers should allocate their income so that