The figure given below shows the revenue and cost curves of a perfectly competitive firm.Figure 10.2
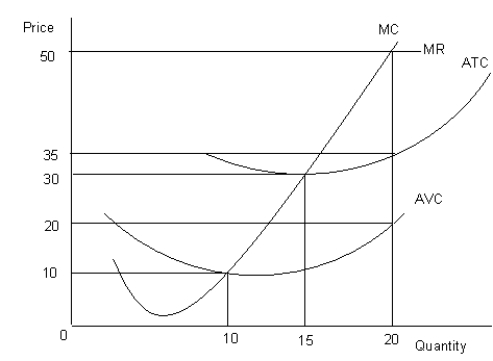 MC: Marginal cost curve
MR: Marginal revenue curve
ATC: Average-total-cost curve
AVC: Average-variable-cost curve
-In the short run, a firm continues to produce only if it can cover the:
Definitions:
Q30: Consider the perfectly competitive firm described in
Q31: In economic theory, we assume that the
Q32: When regulators require that a natural monopoly
Q46: Assume MU<sub>X</sub> = 30 utils, MU<sub>Y</sub> =
Q69: The social cost of a transaction is
Q75: In the case of automobile and medical
Q78: In Figure 10.1, average fixed cost, at
Q100: Firms develop brand names in order to
Q107: Which among the following does not determine
Q129: Refer to Figure 10.2. Compute the profit