The figure given below shows the cost curves of a firm.Figure 9.3
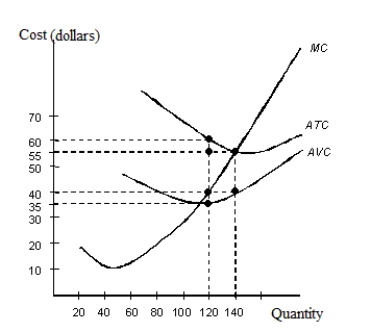 ATC: Average Total Cost
AVC: Average Variable Cost
MC: Marginal Cost
-Refer to Figure 9.3. If the firm maximizes its profit at 120 units of the output, calculate the firm's marginal revenue.
Definitions:
Q9: When a firm's average revenue falls, the
Q14: The efficiency loss that occurs when a
Q15: An oligopoly market consists of:<br>A)many firms which
Q29: Refer to Figure 10.3 and identify the
Q36: Total utility is determined by:<br>A)multiplying the quantity
Q37: Identify the characteristics of a monopoly firm.<br>A)The
Q53: Certain actions by oligopolistic firms can lead
Q83: According to neuroeconomists, our logical brain knows
Q95: According to Table 7.2, marginal utility is
Q114: Compared with generic products, a brand name:<br>A)reduces