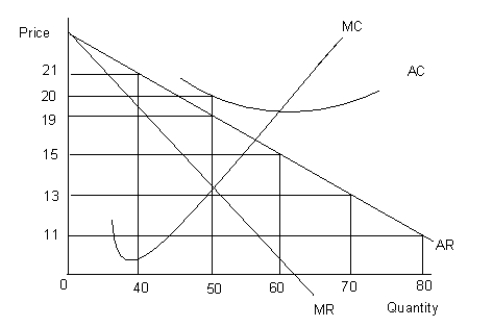
The figure given below shows the revenue and cost curves of a firm. MC represents the marginal cost curve, AC the average cost curve, MR the marginal revenue curve, and AR the average revenue curve.Figure 9.4

-If barriers to entry exist in the market for a product, then:
Definitions:
Book Value
The net value of a company's assets found on its balance sheet, and calculated as total assets minus intangible assets (patents, goodwill) and liabilities.
Market Value
The current price at which an asset or service can be bought or sold in the market.
Total Assets
Represents the sum of all funds, properties, and assets owned by a company or individual at a given time.
Defensive Mergers
Mergers undertaken by companies to protect against potential threats, improve market position, or mitigate weaknesses.
Q15: The only types of firms that cannot
Q38: A perfectly competitive firm cannot affect the
Q44: Perfect price discrimination occurs when:<br>A)each customer is
Q49: What do you mean by the term
Q56: In Figure 9.3, what is the marginal
Q81: According to Table 11.1, at what level
Q86: Assume that as the price of wheat
Q97: A market failure occurs when:<br>A)the market outcome
Q112: One assumption of the model of perfect
Q137: _ is the lack of satisfaction yielded