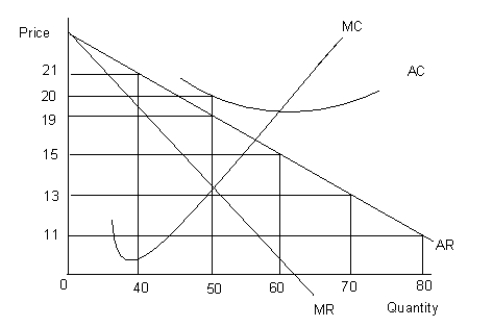
The figure given below shows the revenue and cost curves of a firm. MC represents the marginal cost curve, AC the average cost curve, MR the marginal revenue curve, and AR the average revenue curve.Figure 9.4

-Monopoly is a market structure in which:
Definitions:
Net Present Value
A method used in capital budgeting to analyze the profitability of an investment by calculating the difference between the present value of cash inflows and the present value of cash outflows over a period of time.
Present Value
The present value of a future amount of money or a series of cash flows, discounted by a certain rate of return.
Net Present Value Rule
A principle that states an investment should be made if the net present value of its cash flows, discounted at the hurdle rate, is positive.
Invest
The act of allocating resources, usually money, with the expectation of generating an income or profit.
Q36: Which of the following is true with
Q56: In Figure 9.3, what is the marginal
Q56: The different combinations of any two goods
Q58: Refer to Table 10.1. The firm depicted
Q70: Which of the following is true of
Q82: Asymmetric information arises when:<br>A)both the parties to
Q83: Which of the following theories applies to
Q87: A(n) _ is a price taker.<br>A)monopoly firm<br>B)oligopoly
Q100: In Table 8.4, at 4 units of
Q140: The law of diminishing marginal utility states