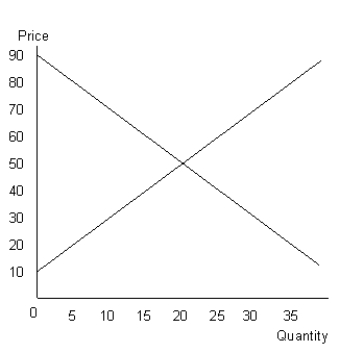
The figure given below shows the aggregate demand and supply curves of a perfectly competitive market.Figure 10.7

-If at the profit maximizing level of output, the AR curve lies below the ATC curve in the short run, the firm is earning positive economic profit.
Definitions:
Initial Investment
The amount of money used to start a project, purchase assets, or invest in securities, which is used as a basis for evaluating the potential profitability of the investment.
Discounting
A financial technique that calculates the present value of future cash flows by applying a discount rate.
Net Present Value
A financial metric that calculates the difference between the present value of cash inflows and the present value of cash outflows over a period of time.
Cash Flows
Cash flows represent the movement of money into and out of a business, indicating its liquidity and financial health.
Q12: Which of the following characteristics distinguishes oligopoly
Q13: What are the three phases of antitrust
Q20: In the long-run, a perfectly competitive firm
Q49: Refer to Table 9.3. The economic profit
Q50: The marginal factor cost (MFC) is the:<br>A)value
Q63: Product differentiation:<br>A)is carried out by both perfectly
Q80: Marginal utility is _.<br>A)always greater than total
Q91: If demand is relatively elastic and supply
Q102: Why does an efficiency loss arise under
Q127: A competitive firm's minimum supply price in