True/False
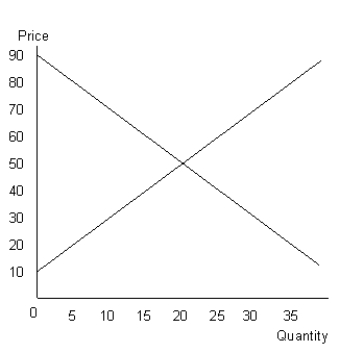
The figure given below shows the aggregate demand and supply curves of a perfectly competitive market.Figure 10.7

-Under long-run equilibrium in perfect competition, each firm operates at the minimum point of its average-variable-cost curve.
Definitions:
Related Questions
Q14: At an output level above the profit-maximizing
Q16: If an average cost curve is U-shaped,
Q21: Suppose a friend gives you two pieces
Q27: The ability of a firm to charge
Q29: The characteristic that distinguishes a monopolistically competitive
Q50: In the long run, a perfectly competitive
Q63: Neuroeconomics suggests that the frontal lobe carries
Q88: Marginal utility is total utility divided by
Q101: If a 10 percent increase in price
Q115: Refer to Table 10.1. If the market