Multiple Choice
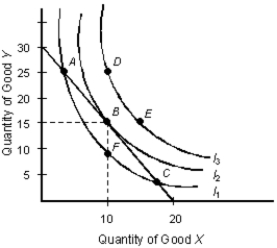
The below figure shows the various combinations of the goods X and Y that yield different levels of utility.Figure 7.3

-If an average cost curve is U-shaped, then:
Definitions:
Related Questions
Q13: Consider the monopolistically competitive firm described in
Q15: What causes the market supply curve to
Q32: When the existing firms in a monopolistically
Q32: Since the beginning of the millennium, the
Q55: Which of the following flows from the
Q72: As the price of a good increases,
Q76: If a monopolist is producing at that
Q104: The demand curve for a product can
Q125: With an increase in income, the consumer
Q125: A perfectly competitive firm's supply curve is