Multiple Choice
The figure given below shows the revenue and cost curves of a perfectly competitive firm.Figure 10.1
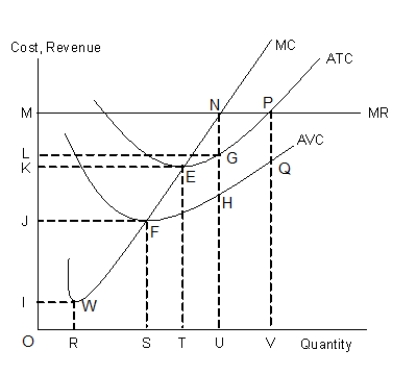
-In Figure 10.1, the firm's profit is equal to the area:
Definitions:
Related Questions
Q6: When a firm incurs negative economic profit,
Q7: If a firm is able to collect
Q43: When product A is a substitute for
Q44: Consider a market consisting of seven firms
Q55: If a good is free, a rational
Q57: A firm enjoys a positive economic profit
Q58: When a good is subsidized by the
Q64: A market in which adverse selection occurs
Q80: Marginal utility is _.<br>A)always greater than total
Q93: Refer to Figure 9.3. If the firm