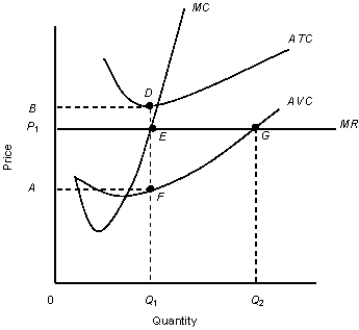
The figure given below shows the revenue and cost curves of a perfectly competitive firm.Figure 10.5
 MC: Marginal cost curve
MR: Marginal revenue curve.ATC: Average-total-cost curve
AVC: Average-variable-cost curve
-One method that firms in many nations use to exit the market is the use of:
Definitions:
Price Level
Refers to the average of current prices across the entire spectrum of goods and services produced in the economy.
Production
The process of combining various material inputs and immaterial inputs (plans, knowledge) to make something for consumption.
Real GDP
Gross Domestic Product adjusted for inflation, providing a more accurate measure of an economy's size and growth rate over time.
Real GDP
The measure of a country's economic output adjusted for price changes (inflation or deflation), reflecting the true value of goods and services produced.
Q15: An oligopoly market consists of:<br>A)many firms which
Q16: The cross-price elasticity between movie tickets and
Q22: Which of the following laws was enacted
Q42: What is the profit-maximizing output level for
Q60: Which of the following calculations is necessary
Q69: Refer to the Figure 8.3. In the
Q72: Refer to Figure 10.2. What is the
Q72: As new firms enter a monopolistically competitive
Q103: Refer to Table 12.2. If firm B
Q109: In Figure 12.2, if the market is