The figure given below shows the demand curves of two classes of buyers, for tickets to a football match.Figure 11.4
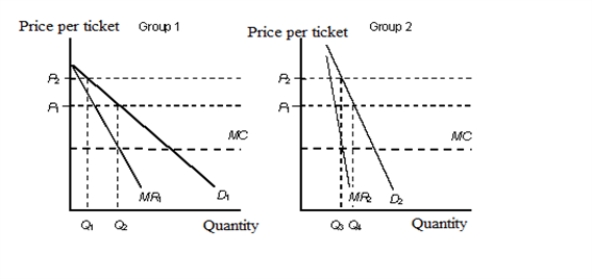 D1: Demand curve of group 1
D2: Demand curve of group 2
MR1: Marginal revenue of group 1
MR2: Marginal revenue of group 2
MC: Marginal cost
-Refer to Figure 11.4. What price must be charged from each group to maximize profits?
Definitions:
Transfer Price
The cost at which products, services, or intellectual property are exchanged between departments inside the same corporation.
Fixed Costs
Expenses that remain constant regardless of the amount of output or sales, including lease payments, employee wages, and insurance costs.
Average Costs
The total costs divided by the total quantity produced, expressing the cost per unit of goods or services.
Transfer Price
The price at which goods, services, or intellectual property are traded between divisions within the same organization.
Q9: The law of diminishing return does not
Q18: Which of the following goods is likely
Q19: In the market for resources, demand and
Q25: According to Figure 14.2, the total clean
Q38: To practice price discrimination, a firm:<br>A)must face
Q57: A firm enjoys a positive economic profit
Q83: According to Figure 16.2, assume that the
Q90: In a price-leadership oligopoly model, the oligopoly
Q110: According to the Table 12.1, if the
Q131: Under perfect competition, the average revenue curve