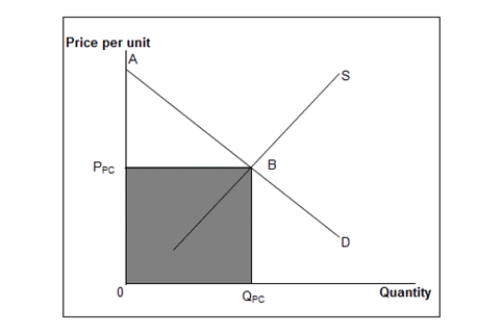
The figure below shows the market equilibrium (point B) at the intersection of demand and supply curves under perfect competition.Figure 11.5
 D: Market demand curve
S: Market supply curve
-Refer to Figure 11.5. Assume that the curve labeled S represents the monopolist's marginal-cost curve and the curve labeled D represents the monopolist's demand curve. Which of the following will represent the consumer surplus?
Definitions:
Self-Awareness
The awareness of one's own personality, emotions, motivations, and wishes.
Individual Differences
Variations among people in their thinking, emotion, personality, and behavior.
Different Personalities
Refers to the range of distinct character traits and behaviors that differentiate one individual from another.
Synergistic Goals
Objectives set by a team or group that can be better achieved together, leveraging each member's strengths for a compounded effect.
Q25: A perfectly competitive firm hires more resources
Q46: A consumer becomes loyal to a product
Q51: Regulation of monopolies is justified on the
Q66: If social regulation increases a firm's fixed
Q76: The market power enjoyed by a particular
Q84: Short run refers to a period of
Q88: A monopolist enjoys the least market power
Q91: A monopolistically competitive firm's demand curve slopes
Q92: Refer to Figure 14.5. What wage rate
Q104: The MR schedule can be obtained from