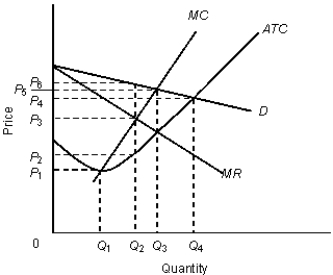
The figure given below shows the revenue and cost curves of a monopolistically competitive firm.Figure: 12.3
 In the figure,
D: Demand curve
MR: Marginal revenue curve
MC: Marginal cost curve
ATC: Average total cost curve
-The monopolistically competitive firm, in Figure 12.3, will maximize profits (or minimize losses) by producing _____ levels of output at a price of _____.
Definitions:
Bureau of Labor Statistics
A U.S. government agency responsible for collecting, analyzing, and disseminating essential statistical data about labor markets, working conditions, and price changes.
U.S. Labor Force
The total supply of workers in the United States, including both employed and unemployed individuals actively seeking employment.
Employment Trends
Patterns or changes in the job market and employment practices over a period, often analyzed to predict future employment scenarios.
External Labor Market
The pool of potential job candidates from outside the organization.
Q3: To avoid driving a natural monopolist into
Q26: In Figure 16.6, assume that the wage
Q38: According to Figure 14.1, the price under
Q41: A monopolistically competitive firm faces a relatively-elastic
Q44: Refer to Table 9.2. If we assume
Q66: With illegal immigration the unskilled labor supply
Q72: An industry which has no barriers to
Q96: For which of the following types of
Q105: A firm whose price is below its
Q124: In the short run, the firm's break-even