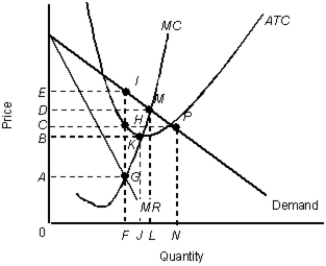
The figure given below shows the revenue and cost curves of a monopolistically competitive firm.Figure 12.4
 MR: Marginal revenue curve
ATC: Average total cost curve
MC: Marginal cost curve
-If firms are successful in product differentiation:
Definitions:
Valuation
The process of determining the present value of an asset or a company, based on its earnings, market position, and future potential.
Private Company
A business owned by private investors, shareholders, or owners, and not publicly traded on stock exchanges. It operates with less regulatory oversight than public companies.
Economic Agreements
Formal arrangements between parties, often nations or businesses, regarding the conduct of economic activity, including trade, investment, and regulation.
Equity
The value of an ownership interest in property, including shareholders' equity in a corporation, representing the residual asset value once liabilities have been subtracted.
Q1: Which of the following statements about a
Q35: A country is likely to have investment
Q39: Why is there a supply point and
Q71: Suppose that in a perfectly competitive market,
Q81: The antitrust laws in the United States
Q82: A firm will always maximize profit at
Q86: Irrespective of the market structure, a firm
Q98: Transfer earning is the minimum amount that
Q100: Refer to Figure 11.6. Assume that marginal
Q106: In many cities, the market for cab