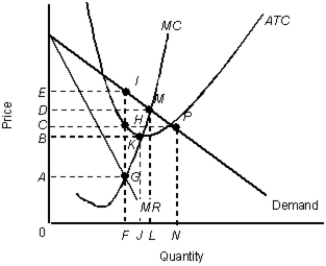
The figure given below shows the revenue and cost curves of a monopolistically competitive firm.Figure 12.4
 MR: Marginal revenue curve
ATC: Average total cost curve
MC: Marginal cost curve
-If firms are successful in product differentiation:
Definitions:
3PL Relationships
Business arrangements between companies and third-party logistics providers to manage and execute logistics services more efficiently.
Logistics and Supply Chain Processes
The integrated activities required to plan, control, and execute a product's flow from materials to production to distribution in the most economical way possible.
Process Model
A representation or simulation of an actual process, detailing the steps and sequences involved, often used for analysis, optimization, and communication.
Logistics and Supply Chain Needs
The requirements and activities involved in the planning, control, and movement of materials, goods, and information from origin to consumption.
Q14: The efficiency loss that occurs when a
Q30: The International Communication Network which is the
Q30: A monopolist can charge a high price
Q35: A country is likely to have investment
Q35: After hiring 151 units of the variable
Q43: Why are a large number of IT
Q54: It is often impossible for a business
Q74: Sometimes the only information that is available
Q82: Asymmetric information arises when:<br>A)both the parties to
Q83: When the commons are converted into privately