The figure below shows the demand and supply curves in the market for elementary education.Figure 13.1
In the figure,
D: Private demand curve for elementary education
D + s: Demand curve which includes public benefits
S: Supply curve of education
Price and Quantity have been taken on vertical and horizontal axes respectively. 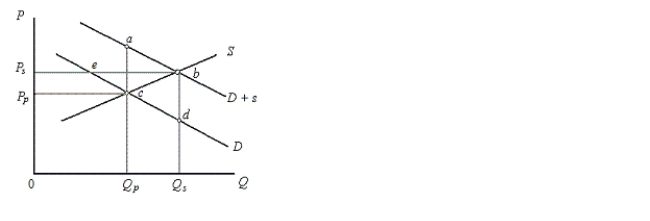
-According to figure 13.1, the optimal subsidy is equal to:
Definitions:
Significant Problems
Issues or difficulties of considerable importance or consequence that require attention and resolution.
Attachment Patterns
Distinct styles of forming emotional bonds and relationships, influenced by early interactions with caregivers.
Anxious/Avoidant
A style of attachment seen in some individuals who typically avoid close relationships and exhibit anxiety about getting close to others.
Anxious/Resistant
A type of attachment style observed in some children, characterized by intense distress when separated from caregivers and ambivalence upon their return.
Q1: A monopolist produces at the minimum point
Q9: Assume that the firm in Figure 12.4
Q13: Which of the following reasons will most
Q20: In contrast to both perfect competition and
Q21: Delegates from different countries of the world
Q34: Figure 13.1 represents a situation of:<br>A)positive externalities.<br>B)negative
Q53: According to Figure 14.2, the total clean
Q92: Refer to Figure 14.5. What wage rate
Q102: Which of the following indexes includes the
Q110: Refer to Figure 10.3 and calculate the