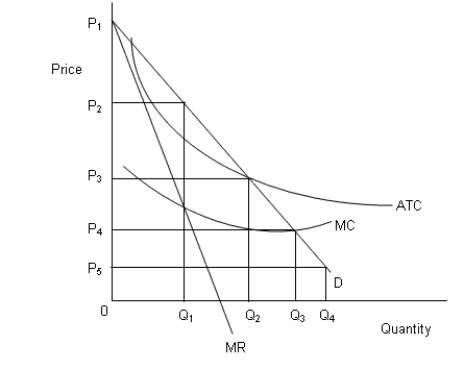
The figure below shows revenue and cost curves of a natural monopoly firm.Figure 14.1
 In the figure,
D: Demand curve
MR: Marginal revenue curve
MC: Marginal cost curve
ATC: Average total cost curve
-According to Figure 14.1, the price under perfect competition will be:
Definitions:
Net Social Benefits
The difference between the total benefits and total costs of a project or policy when considering its impact on society as a whole.
Consumers
Individuals or groups who purchase goods and services for personal use, driving demand in the economy.
Taxpayers
Individuals or entities that are obligated to pay taxes to a governmental authority, based on income, property value, or consumption.
Parity
The state of being equal or equivalent in terms of value, status, or amount.
Q1: The "Public Choice" school of economists argue
Q39: Under perfect competition, existing firms leave the
Q41: Since only a few firms dominate the
Q61: The market structure called monopolistic competition is
Q79: According to Figure 14.2, the total social
Q85: One major similarity between perfect competition and
Q89: The Dot-Com bubble in the U.S. occurred
Q94: If a monopolist is producing the output
Q102: Refer to Table 13.2. Suppose fish sells
Q115: Refer to Table 10.1. If the market