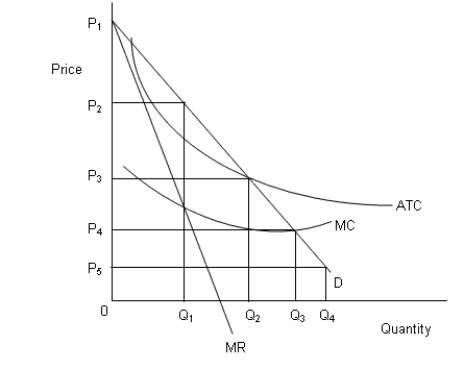
The figure below shows revenue and cost curves of a natural monopoly firm.Figure 14.1
 In the figure,
D: Demand curve
MR: Marginal revenue curve
MC: Marginal cost curve
ATC: Average total cost curve
-Which of the following calculations is necessary to determine whether a regulation should be implemented?
Definitions:
Capital Structure
The mix of a company's long-term liabilities, specific short-term liabilities, common equity and preferred equity, which funds its overall operations and growth.
Interest Tax Shield
The reduction in taxable income for individuals or corporations achieved by deducting interest payments on borrowed funds.
M&M Proposition II
A theory proposing that the cost of equity increases as a company increases its leverage, due to the riskier equity stream.
Debt-Equity Ratio
A ratio assessing the comparative financing from equity and debt for a company’s assets.
Q8: The marginal revenue product curve of a
Q31: Following are the controversies over how poverty
Q32: When regulators require that a natural monopoly
Q68: A Herfindahl index of 5,000 would indicate:<br>A)a
Q74: If the price of marketable permits is
Q80: As a firm in a monopolistically competitive
Q96: For a monopolist with a linear demand
Q103: When a new generation of computers, which
Q106: Which of the following is true of
Q107: Mutual funds that are composed of corporate