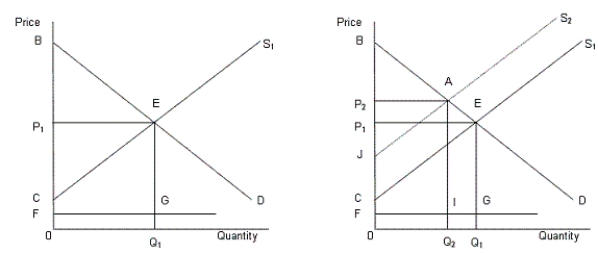
In the following figure, the first panel shows a market situation prior to regulation and the second panel shows the effects of regulation.Figure 14.2
 In the figure,
D: Demand curve for automobiles
S1: Supply curve of automobiles prior to regulation
S2: Supply curve of automobiles after regulation
FG: Clean up cost per unit
-Graphically, consumer surplus is the area:
Definitions:
Contractual Agreement
A legally binding agreement between two or more parties, outlined in a document, that is enforceable by law.
FDIC
The Federal Deposit Insurance Corporation, a U.S. government agency that insures deposits in banks and thrift institutions for at least $250,000 per depositor, per bank.
Restrictive Indorsement
An endorsement on a negotiable instrument, like a check, that limits its use, such as specifying that the instrument must be deposited into a particular account.
Negotiates
The act of discussing something formally to reach an agreement, often in business or diplomatic discussions.
Q4: If both demand for and supply of
Q7: Sherman Antitrust Act bans price discrimination that
Q23: If a dollar spent on capital yields
Q25: Which of the following will be the
Q36: Refer to Figure 11.5. Assume that the
Q42: In order to reduce the possibility of
Q70: If losses are incurred in a competitive
Q79: If the government sets a minimum wage
Q103: If a monopolist is producing at a
Q115: Which of the following can result in