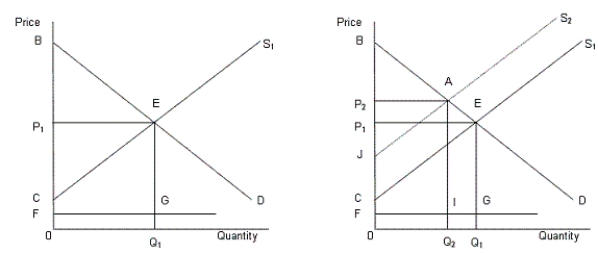
In the following figure, the first panel shows a market situation prior to regulation and the second panel shows the effects of regulation.Figure 14.2
 In the figure,
D: Demand curve for automobiles
S1: Supply curve of automobiles prior to regulation
S2: Supply curve of automobiles after regulation
FG: Clean up cost per unit
-Restrictions on the types of food additives that breakfast cereal manufacturers can use is an example of a social regulation.
Definitions:
Standard Deviation
A metric that calculates the degree of spread or scattering within a data set.
Nearly Normal Condition
Nearly normal condition refers to a situation where a dataset or distribution closely approximates a normal distribution, meeting certain criteria for statistical analyses.
Confidence Interval
A range of values, derived from a dataset, that is used to estimate the likelihood of containing the true mean or proportion of the whole population.
Degrees of Freedom
The number of independent values or quantities which can be assigned to a statistical distribution, typically influencing the shape of the distribution.
Q3: Under perfect competition in the resource market,
Q12: A clothing store can sell two shirts
Q31: Following are the controversies over how poverty
Q34: Figure 13.1 represents a situation of:<br>A)positive externalities.<br>B)negative
Q46: The Civil Rights Act of 1964 in
Q75: In the context of market structure, the
Q77: When resources are commonly owned, there are
Q77: A regulated monopoly is a monopoly which
Q85: In Country X, the highest 10 percent
Q113: All of the following are reasons for