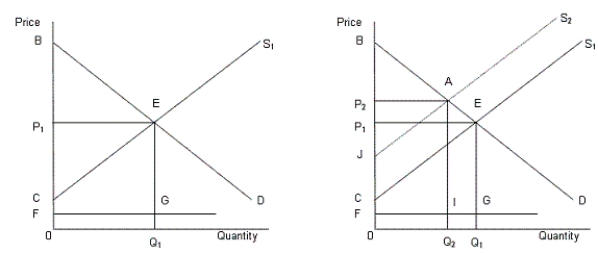
In the following figure, the first panel shows a market situation prior to regulation and the second panel shows the effects of regulation.Figure 14.2
 In the figure,
D: Demand curve for automobiles
S1: Supply curve of automobiles prior to regulation
S2: Supply curve of automobiles after regulation
FG: Clean up cost per unit
-According to Figure 14.2, the total clean up cost after the regulation is the:
Definitions:
Q27: The major problem with common ownership is
Q35: According to Figure 13.2:<br>A)both points a and
Q39: The value of the marginal product of
Q41: The supply of land being fixed, the
Q54: Which of the following is a nonrenewable
Q67: A monopoly is a market model in
Q81: A regressive tax structure is one:<br>A)in which
Q87: Which of the following factors will help
Q101: In monopolistic competition, firms may differentiate their
Q108: The marginal revenue product is:<br>A)the value of