Essay
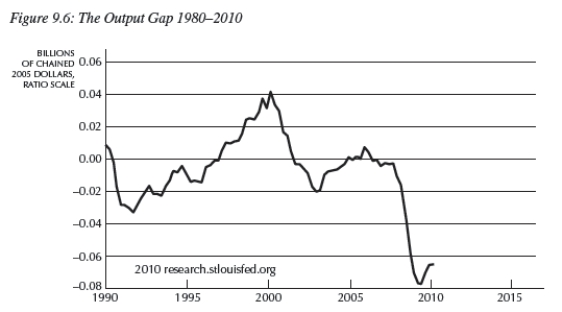
-Figure 9.6 below shows the output gap for the years 1990-2010.Using the Phillips curve and Okun's law,discuss the impacts on inflation and unemployment for the years 1997-2000 and 2008-2010.From this analysis,what is the relationship between unemployment and inflation?
Definitions:
Related Questions
Q7: The foundation of the IS curve is
Q16: Consider Table 7.1.In January 2007,the unemployment rate
Q33: Consider Figure 13.2.The aggregate demand curve _
Q35: If we define the saving rate as
Q41: Consider Figure 12.8,which shows the change in
Q76: If nominal interest rates are high,you:<br>A)hold only
Q83: An implication of sticky inflation is that,through
Q86: If we define the saving rate as
Q96: The most immediate and visible form of
Q116: If the production function is given by