Multiple Choice
The following graph shows the demand and supply curves of a resource. The total resource earnings in equilibrium equal _____. Figure 11.4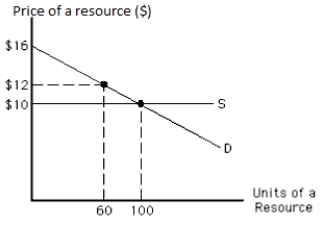
Definitions:
Related Questions
Q1: Suppose a perfectly competitive firm and industry
Q7: Which of the following is true for
Q9: Which of the following does not affect
Q18: For wage rates between $7 and $15
Q19: Collective bargaining is the process by which
Q30: The following graph shows the labor market.
Q44: Imperfect information among the potential bidders of
Q65: Marginal revenue is defined as:<br>A)total revenue divided
Q93: When David Palmisano won the Powerball lottery,
Q122: Screening is the attempt by the uninformed