Multiple Choice
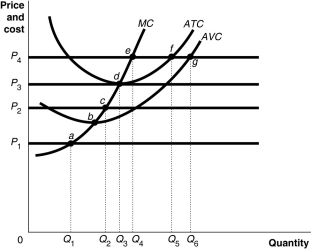
Figure 7-7  Figure 7-7 shows cost and demand curves facing a profit-maximising, perfectly competitive firm.
-Refer to Figure 7-7.At price P2,the firm would produce
Definitions:
Related Questions
Q8: Refer to Figure 5-3.What is the value
Q17: A monopoly is characterised by all of
Q47: Refer to Figure 7-3.Suppose the prevailing price
Q69: Refer to Table 5-4.Suppose that the quantity
Q74: For a natural monopoly,the marginal cost of
Q79: What is the difference between 'diminishing marginal
Q142: If the market price is at equilibrium,the
Q171: Refer to Table 6-4.The table above shows
Q192: Refer to Figure 8-6.The profit-maximising output and
Q233: If a firm knew every consumer's willingness