Table 14-4 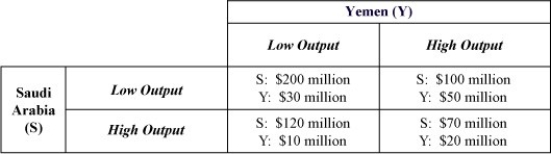
-Refer to Table 14-4.Suppose the payoff matrix in the above figure represents the payoffs to Saudi Arabia and Yemen for the production of oil.Saudi Arabia and Yemen must decide how much oil to produce.Since the demand for oil is inelastic,relatively low production rates drive up prices and profits.Saudi Arabia,the world's largest and lowest cost producer,is able to influence market price; it has an incentive to keep output low.Yemen,on the other hand,is a relatively high cost producer with much smaller reserves.Assume Saudi Arabia now decides to try to further influence the oil market by offering to pay Yemen $25 million to produce a low output.
a.Create a new payoff matrix that reflects Saudi Arabia's willingness to pay Yemen $25 million to produce a low output.
b.What is the dominant strategy for each country in this new game?
c.What is the new Nash equilibrium?
Definitions:
Utility Function
An economic model that ranks an individual's preferences for different combinations of various goods and services.
Edgeworth Box
A diagrammatic tool used in microeconomics to show various distributions of resources or outcomes between two agents in an economy.
Contract Curve
In economics, a curve representing the set of optimal allocation points for two parties trading two goods, assuming utility maximization.
Competitive Equilibrium
A state in a market where supply equals demand, and the prices enable buyers and sellers to be in equilibrium.
Q6: What are the five most important variables
Q31: Because a monopoly's demand curve is the
Q48: Let MP = marginal product,P = output
Q66: Refer to Figure 11-7.The lines shown in
Q69: Refer to Figure 16-4.Suppose the firm represented
Q78: Golda Rush quit her job as a
Q81: Economists agree that a monopolistically competitive market
Q91: What is odd pricing? Why do some
Q95: Which of the following firms is not
Q131: Suppose the per-unit production cost of a