The figure below shows the revenue and cost curves for a profit-maximizing monopolist. Based on the figure, the region bounded by FAGB represents _____.FIGURE 8-2 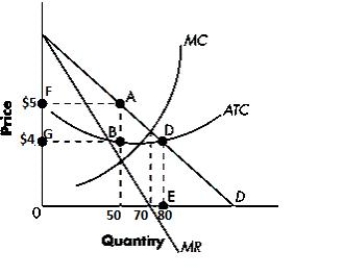
Definitions:
Production Possibilities Curve
A graphical representation that shows the maximum number of goods or services that can be produced within an economy given available resources and technology.
Full Employment
A situation in which everyone who wants to work can find employment at prevailing wage rates.
Serious Recession
A drastic downturn in economic activity across the economy that lasts for an extended period, often characterized by significant declines in GDP and other economic indicators.
Bubonic Plague
A highly infectious and often fatal disease caused by the bacterium Yersinia pestis, characterized by fever, delirium, and the formation of buboes, historically responsible for major pandemics.
Q5: Why is television broadcasting over the air
Q23: Which of the following is an example
Q37: A major macroeconomic goal of nearly every
Q54: Unionization provides _ in certain occupations, and,
Q55: A linear demand curve for a good
Q56: The figure below shows the various cost
Q58: Producer surplus for a particular unit of
Q83: The unemployment rate measures the number of
Q88: The figure below shows the revenue and
Q97: If some non-price level determinant causes total