Use the following to answer questions:
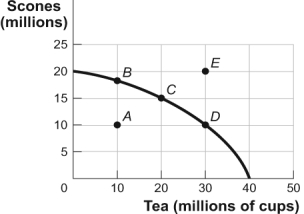
Figure: Production Possibility Frontier Curve for Tealand 
-(Figure: Production Possibility Frontier for Tealand) Look at the figure Production Possibility Frontier for Tealand. If Tealand is producing 10 million scones and 10 million cups of tea (point A) , we know that the economy:
Definitions:
Out-of-state Motorists
Drivers or vehicle operators who are registered or licensed in a state other than the one they are currently driving in.
Linear Model
A type of statistical model that assumes a linear relationship between the input variables (predictors) and the single output variable (response).
Confidence Interval
An array of values extracted from sample analysis likely to encompass the value of an undefined population parameter.
Scatter Plot
A type of plot or mathematical diagram using Cartesian coordinates to display values for typically two variables for a set of data, showing how much one variable is affected by another.
Q31: The production possibility frontier will shift outward
Q47: (Figure: Supply of Coconuts) Look at the
Q78: If chicken and beef are substitutes, then
Q112: The models that economists construct:<br>A) usually make
Q160: If the demand for tires goes down
Q165: Because people usually exploit opportunities to make
Q179: Along a given upward-sloping supply curve, a
Q223: Total surplus in a market is the
Q279: _ illustrates a positive relationship between price
Q288: (Figure: The Demand and Supply of Wheat)