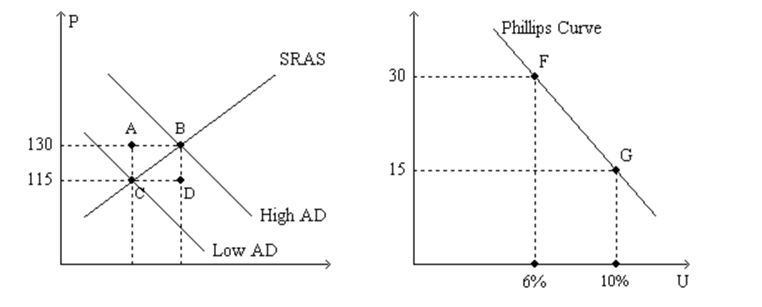
Figure 35-1.The left-hand graph shows a short-run aggregate-supply (SRAS) curve and two aggregate-demand (AD) curves.On the right-hand diagram,U represents the unemployment rate. 
-Refer to Figure 35-1.What is measured along the horizontal axis of the left-hand graph?
Definitions:
Q4: As an economist working for a U.S.government
Q9: Country A has a higher money supply
Q20: Refer to Stock Market Boom 2015.What happens
Q27: When the Federal Open Market Committee meets
Q31: A favorable supply shock shifts the short-run
Q37: Demand for workers in some industry declines.These
Q41: In the short run,policy that changes aggregate
Q42: For which of the following policies is
Q54: Refer to Figure 35-3.What is measured along
Q85: Suppose the Fed decreased the growth rate