Instruction 12-12
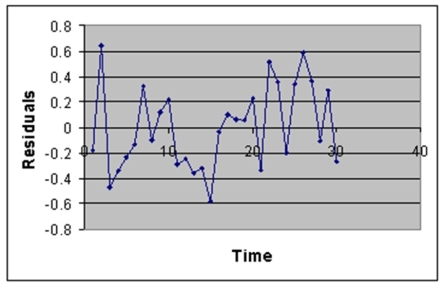
The manager of the purchasing department of a large savings and loan organization would like to develop a model to predict the amount of time (measured in hours) it takes to record a loan application.Data are collected from a sample of 30 days,and the number of applications recorded and completion time in hours is recorded.Below is the regression output:
Note: 4.3946E-15 is 4.3946 x 10⁻¹⁵.
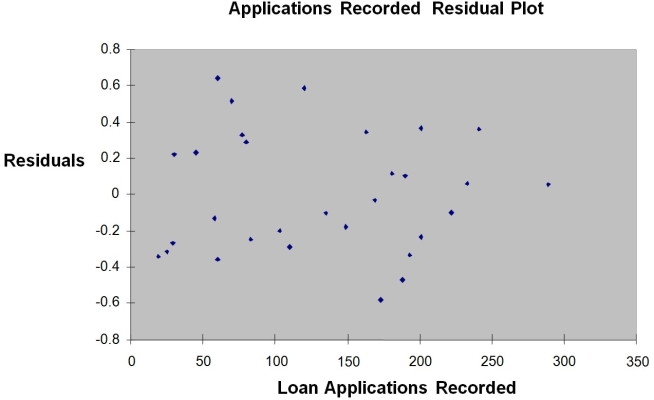
-Referring to Instruction 12-12,to test the claim that the mean amount of time depends positively on the number of loan applications recorded against the null hypothesis that the mean amount of time does not depend linearly on the number of invoices processed,the p-value of the test statistic is
Definitions:
Planned Investment
The expenditure by businesses on capital goods that are intended to increase their productive capacity in the future.
Real Gross Domestic Product
The evaluation of a nation's economic output after adjusting for any price variations, including inflation or deflation, to reveal the genuine quantity of produced goods and services.
Money Supply
The sum of all available money in an economy at a given moment, encompassing cash, coins, and bank account balances.
Real GDP
The measure of the value of economic output adjusted for price changes (inflation or deflation), reflecting the real volume of production.
Q16: Referring to Instruction 11-4,at 1% level of
Q56: A powerful women's group has claimed that
Q68: Referring to Instruction 13-14,the value of the
Q71: Referring to Instruction 12-11,which of the following
Q78: Referring to Instruction 9-3,the parameter of interest
Q83: Referring to Instruction 11-3,what should be the
Q104: Referring to Instruction 13-4,what are the regression
Q129: Referring to Instruction 12-10,construct a 95% prediction
Q184: Referring to Instruction 13-16 Model 1,which of
Q213: Referring to Instruction 13-15,the analyst wants to