Instruction 12-11
A computer software developer would like to use the number of downloads (in thousands) for the trial version of his new shareware to predict the amount of revenue (in thousands of dollars) he can make on the full version of the new shareware.Following is the output from a simple linear regression along with the residual plot and normal probability plot obtained from a data set of 30 different sharewares that he has developed:
ANOVA
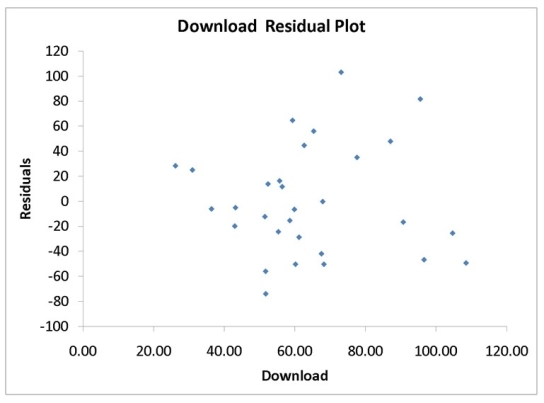
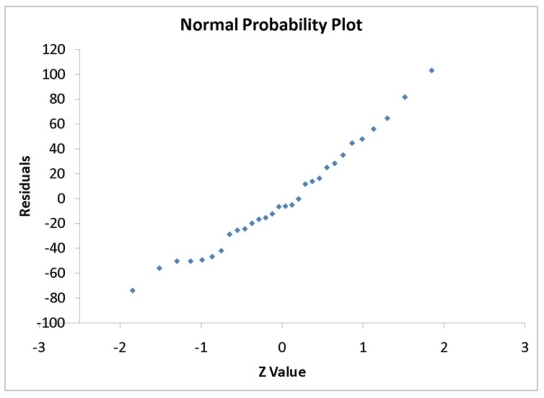
-Referring to Instruction 12-11,which of the following assumptions appears to have been violated?
Definitions:
Life Expectancy
This term refers to the average number of years a person is expected to live based on statistical averages, often influenced by factors like genetics, lifestyle, and healthcare access.
Economic Losses
Financial deficits suffered by individuals, organizations, or nations due to adverse events, investments, or disasters.
Health Care System
The organization of people, institutions, and resources that deliver health care services to meet the health needs of target populations.
Convergence Hypothesis
The theory suggesting that as economies develop, they begin to resemble each other more closely in terms of economic structure and output.
Q2: The Paasche price index uses the consumption
Q30: Referring to Instruction 12-12,there is sufficient evidence
Q77: Referring to Instruction 13-5,at the 0.01 level
Q80: Referring to Instruction 14-14,the value of the
Q105: The Y-intercept (b<sub>0</sub>)represents the<br>A)variation around the sample
Q121: Referring to Instruction 12-2,what is the percentage
Q124: In testing for the differences between the
Q144: Which of the following statements is NOT
Q213: Referring to Instruction 13-15,the analyst wants to
Q249: Referring to Instruction 13-14,the Head of Department