Use the following to answer question:
Figure: Monopoly Profits in Duopoly 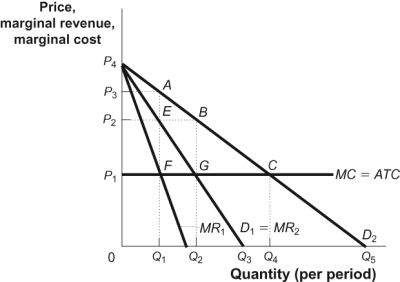
-(Figure: Monopoly Profits in Duopoly) Use Figure: Monopoly Profits in Duopoly.Suppose there are two firms in this industry.Each firm faces an identical demand curve,D1, and the market demand curve is D2.The figure illustrates how firms can reap monopoly profits,even in an industry with:
Definitions:
Financial Information
Data concerning the financial status of an entity, including balance sheets, income statements, cash flow statements, and more, used in decision-making processes.
Financial Information
Data pertaining to the monetary transactions, assets, liabilities, and overall financial health of an entity.
Debt-to-Equity Ratio
A financial ratio indicating the relative proportion of shareholders' equity and debt used to finance a company's assets.
Financial Information
Data concerning the financial status and performance of an individual or organization, including income, expenses, and assets.
Q9: (Figure: A Profit-Maximizing Monopoly Firm)Use Figure: A
Q52: If a monopolist is producing a quantity
Q54: Automobile emissions generate pollution,have health costs for
Q72: To increase profits with price discrimination,different groups
Q85: (Table: Demand Schedule of Gadgets)Use Table: Demand
Q153: If Coke is able to use product
Q179: (Figure: Profits in Monopolistic Competition)Use Figure: Profits
Q218: Advertising is an example of price leadership.
Q245: (Scenario: Two Identical Firms)Use Scenario: Two Identical
Q262: Monopoly is inefficient because some consumer surplus