Multiple Choice
Use the following to answer question: 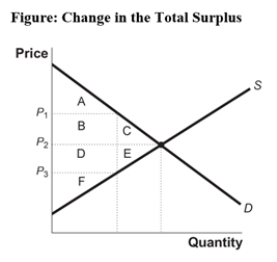
-(Figure: Change in Total Surplus) Look at the figure Change in Total Surplus.Which areas represent the change in total surplus when the price falls from P1 to P2?
Definitions:
Related Questions
Q52: (Figure: The Demand Curve)Use Figure: The Demand
Q58: Which scenario is most likely to INCREASE
Q73: (Figure: Supply of Coconuts)Use Figure: Supply of
Q73: (Figure: Wireless Mouse Market)Look at the figure
Q76: To be binding,a price ceiling must be
Q91: (Table: Market for Butter)Use Table: Market for
Q101: Which influence does NOT shift the supply
Q136: The Montreal Symphony Orchestra wants to make
Q138: (Figure: Shifts in Demand and Supply IV)Use
Q173: (Figure: Shifts in Demand and Supply III)Use