A forester would like to know how big a maple tree might be at age 50 years.She gathers data from some trees that have been cut down,and plots the diameters (in inches)of the trees against their ages (in years).She re-expresses the data,using the logarithm of age to try to predict the diameter of the tree.Here are the regression analysis and the residuals plot.Explain why you think this is an appropriate model. Dependent variable is: Diam
Rsquared
Constant
Log(Age) 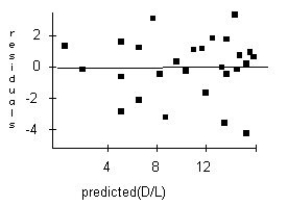
Definitions:
Proportion
A statistical measure that reflects the fraction of the total number of occurrences for a specific outcome.
Hypotheses
Formally proposed explanations for a phenomenon, which are typically tested through research and experiments to be supported or refuted.
Z Statistic
The Z statistic, or Z-score, is used in hypothesis testing, measuring the number of standard deviations a datapoint is from the population mean.
P-value
A measure in statistical hypothesis testing representing the probability of obtaining a result at least as extreme as the one observed, under the assumption that the null hypothesis is true.
Q3: A science instructor assigns a group of
Q12: The following contingency table provides a
Q20: The lengths of long distance phone calls
Q39: Consider a game that consists of dealing
Q60: Consider a game that consists of dealing
Q68: A random sample of records of electricity
Q75: Two different tests are designed to
Q79: A researcher wants to investigate whether different
Q85: After increased patrol,33% of vehicles on a
Q94: Consider a game that consists of dealing