Here is a histogram of the assets (in millions of dollars) of 71 companies. 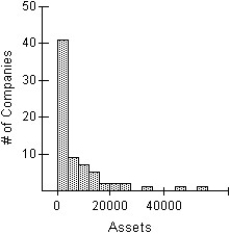 Which of the following is the most appropriate re-expression of these data? Explain.
I 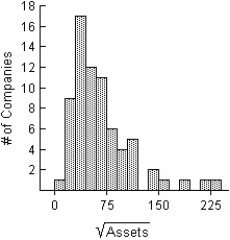
II 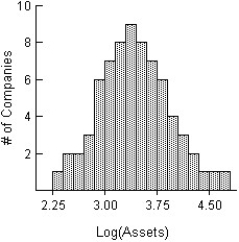
III 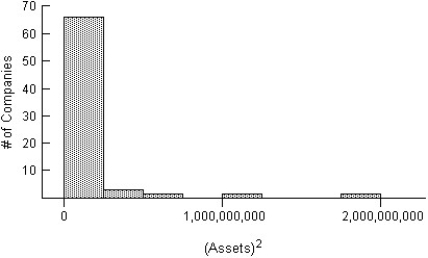
Definitions:
Table Datasheet View
A view in database applications that displays data in a tabular format, allowing for editing and querying of the data.
Field Name
The identifier or label assigned to a field or column in a database to describe the data it contains.
Field Size
Refers to the maximum amount of data that can be stored in a database field, often determined by the data type and defined settings.
Default Value
A predefined data value that is automatically assigned to a database field unless specified otherwise by the user.
Q9: A study finds a strong positive association
Q34: An English instructor gave a final exam
Q34: You polled other managers to get their
Q46: Mr.Smith works at a computer consultant company
Q49: A random sample of 150 yachts
Q59: One of the fastest-growing areas of environmental
Q62: A college examined the impact of
Q67: In a clinical trial,780 participants suffering from
Q105: Office workers were asked how long
Q128: Shown below are the boxplot and the