The graph in the following figure gives the times that it takes a vehicle to reach speeds from 0 mph to 25 mph, in increments of 5 mph, with a curve connecting them. Count the squares under the curve to estimate this distance. Estimate the distance traveled by the vehicle in 14 seconds, to a speed of 25 mph. (Be careful with time units.) 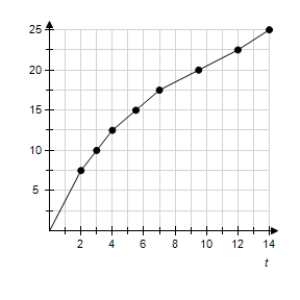
Definitions:
CAPM
The Capital Asset Pricing Model, a theory used to determine the expected return on investment based on its inherent risk and the cost of capital.
Expected Return
The anticipated profit or loss from an investment based on its potential risks and rewards.
SML
The Security Market Line (SML) represents the relationship between the expected return of a market security and its risk, measured by beta, within the Capital Asset Pricing Model (CAPM).
Market Portfolio
A theoretical bundle of investments that includes every type of asset available in the market, with each asset weighted by its total market capitalization.
Q5: A continuous income stream has an annual
Q35: Suppose that the production function for a
Q54: Suppose that the joint cost (in dollars)
Q56: Use integration by parts to evaluate <img
Q66: Find the intercepts of the following function.
Q95: Retailers will buy 45 cordless phones from
Q137: Use integration by parts to evaluate <img
Q142: Evaluate the improper integral if it converges,
Q161: Evaluate the improper integral if it converges,
Q325: Suppose the marginal cost for x units