Multiple Choice
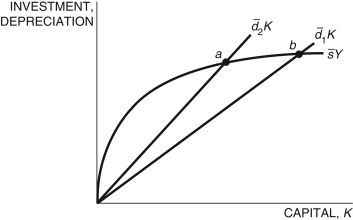
Refer to the following figure when answering
Figure 5.5: Solow Diagram 
-Consider Figure 5.5, which represents two countries, 1 and 2. Country ________ has a higher depreciation rate and, therefore, has a ________ steady state than the other country.
Definitions:
Related Questions
Q1: In the labor market depicted in
Q26: In the equation <span class="ql-formula"
Q29: Consider Table 2.1, which tabulates GDP for
Q36: In the equation <br> <span class="ql-formula"
Q53: What country or countries do the following
Q67: Suppose an economy's natural rate of
Q75: The equation <span class="ql-formula" data-value="\bar
Q78: Defining <span class="ql-formula" data-value="Y _
Q90: Consider Figure 9.4, which shows the annual
Q126: Both the United States and France, among