Exhibit 16-7.It is believed that the sales volume of one liter Pepsi bottles depends on the price of the bottle and the price of one liter bottle of Coca Cola.The following data has been collected for a certain sales region. 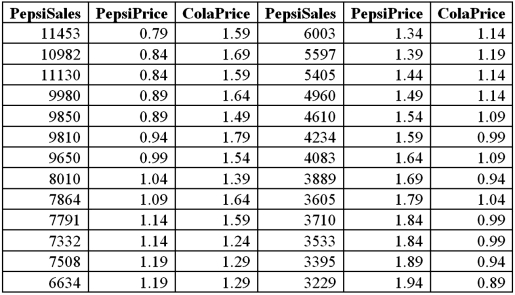 Using Excel's regression,the linear model PepsiSales = β0 + β1PepsiPrice + β2ColaPrice + ε and the log-log model ln(PepsiSales)= β0 + β1ln(PepsiPrice)+ β2ln(ColaPrice)+ ε have been estimated as follows:
 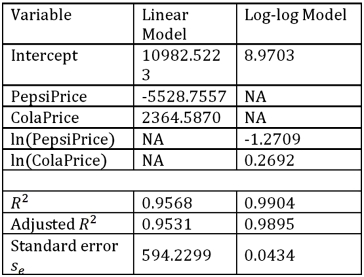 (Use Excel. )Refer to Exhibit 16.7.Which of the two models provides a better fit?
Definitions:
Demand for Artichokes
The desire or need expressed by consumers to purchase and consume artichokes, influenced by factors such as price, income, and taste preferences.
Inelastic Demand
A situation where the demand for a good or service does not significantly change in response to price changes.
Total Expenditures
The overall amount spent on goods and services.
Utility Function
A mathematical representation of how individual preferences are aggregated to represent satisfaction or utility from consuming goods and services.
Q2: Packaged candies have three different types of
Q24: A simple linear regression,<img src="https://d2lvgg3v3hfg70.cloudfront.net/TB2339/.jpg" alt="A simple
Q38: Exhibit 12.7 The heights (in cm)for a
Q46: The nonparametric test for two population medians
Q53: Exhibit 16.5.The following data shows the demand
Q66: If the null hypothesis is rejected by
Q70: Exhibit 13.8 A market researcher is studying
Q71: Exhibit 17.9.A bank manager is interested in
Q79: The capital asset pricing model is given
Q84: How many coefficients have to be estimated