Present Value of 1 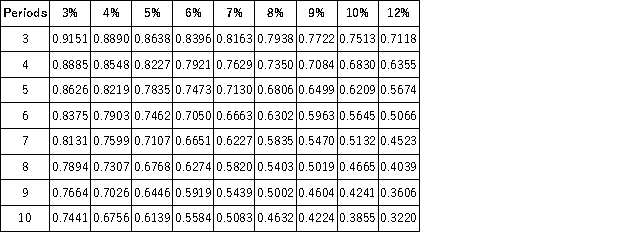 Future Value of 1
 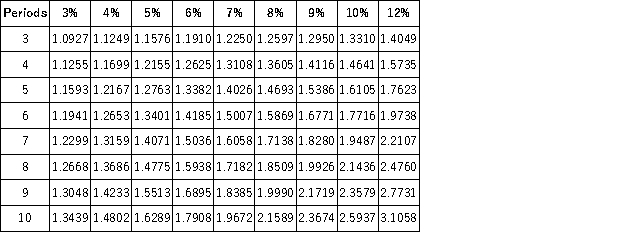 Present Value of an Annuity of 1
 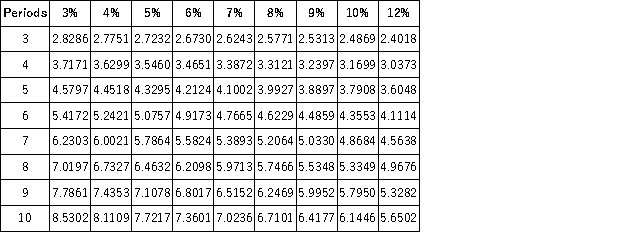 Future Value of an Annuity of 1
 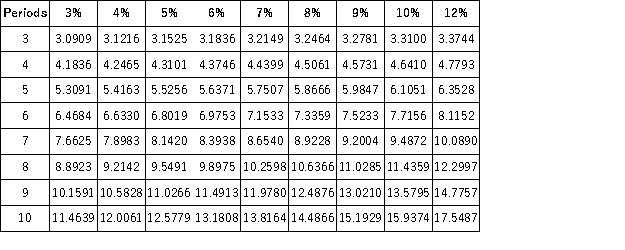 The present value factor for determining the present value of $6,300 to be received three years from today at 10% interest compounded semiannually is 0.7462.
n = 6 semiannual periods, i = 5% semiannual interest rate; from the PV of $1 table the factor is 0.7462
Definitions:
Q1: A partnership that has two classes of
Q5: Promoting ill opinions of government in the
Q6: What are the accounting basics for debt
Q7: By virtue of the due process clause
Q16: Each year the U.S.Supreme Court receives several
Q27: Which of the following is not one
Q75: Present Value of 1 <img src="https://d2lvgg3v3hfg70.cloudfront.net/TB6316/.jpg" alt="Present
Q88: Conklin plans to leave the CAP Partnership.
Q144: A decrease in the fair value of
Q178: Flitter reported net income of $17,500 for