Figure 2-16
In the following graph the x-axis shows the number of times a commuter rail train stops at a station per hour and the y-axis shows the number of commuter rail passengers per hour.
Commuter Rail Passengers by Frequency of Service
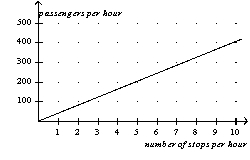
-Refer to Figure 2-16.A policymaker observes this graph and concludes that increasing the frequency of commuter rail service is a certain way to get more commuters to choose the commuter rail instead of driving their own cars.You warn the policymaker about making a reverse causality mistake with which of the following statements?
Definitions:
Implicit Memory
Unconscious memory: subjects can demonstrate knowledge, such as a skill, conditioned response, or recall of events on prompting but cannot explicitly retrieve the information.
Verbal Tasks
Cognitive tasks involving language, such as speaking, reading, and writing, used to assess linguistic skills and brain function.
Motor Tasks
Activities that require the brain to plan and execute movements, often involving coordination and strength.
Q43: Market power refers to the<br>A) power of
Q85: When constructing a production possibilities frontier, which
Q158: Zora can produce 4 quilts in a
Q179: Refer to Figure 2-8, Panel (a) and
Q207: Which of the following would not result
Q220: Refer to Figure 2-6. This economy has
Q251: If Germany chooses to engage in trade,
Q270: Refer to Figure 2-16. A policymaker observes
Q375: The argument that purchases of minivans cause
Q426: Where can an economy not produce?<br>A) inside