The graph shows the volume of wood produced in a single-species forest. Here  is measured in cubic meters/hectare and t is measured in years. By computing the slopes of the respective tangent lines, estimate the rate at which the wood grown is changing at the beginning of year 10 and at the beginning of year 40.
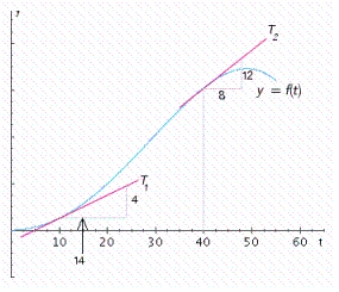
Definitions:
Q12: Which of the following is a common
Q28: Perform the indicated operations and simplify the
Q29: Evaluate the expression. <img src="https://d2lvgg3v3hfg70.cloudfront.net/TB6026/.jpg" alt="Evaluate the
Q40: Perform the indicated operations and simplify the
Q66: Use a differential to approximate the quantity
Q98: Find the interval(s) where the function is
Q122: A stone is thrown straight up from
Q124: Evaluate the expression. <img src="https://d2lvgg3v3hfg70.cloudfront.net/TB6026/.jpg" alt="Evaluate the
Q177: Find the values of x for which
Q314: Find the second derivative of the function.