To evaluate cardiac function, scientists and physicians measure both the pressure and the volume inside the heart. When both pressure and volume data are plotted on the same graph, the resulting graph is called a pressure-volume loop. To create a pressure-volume loop, a catheter (a thin tube) is inserted into the vessels of the heart, and measurements of both left ventricular pressure and left ventricular volume are taken. The data are plotted on a graph, and cardiac function can then be evaluated from the distribution of the data and the shape of the loop.
The following figure shows a typical left ventricle pressure-volume loop for a healthy young adult. The cardiac cycle proceeds counterclockwise. Each complete turn around the loop (for example, starting at point A and ending back at point A) represents one complete cardiac cycle.
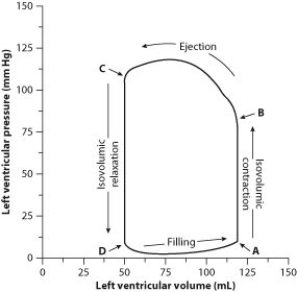
-At what point of the diagram is the left ventricle filled with the least amount of blood and at the highest pressure?
Definitions:
Primary Visual Cortex
A region in the occipital lobe of the brain responsible for processing visual information from the eyes.
Immune-System Response
The reaction of the immune system in defending the body against pathogens, including viruses, bacteria, and other harmful organisms.
Eustress
Positive stress that results from experiencing manageable levels of stressors, leading to improved performance and well-being.
Stressor
Any event, situation, or stimulus that causes stress or strain to an individual.
Q14: The hydrogen atoms of a water molecule
Q17: The oxygen-carrying component in red blood cells
Q21: Heartburn is usually caused by the<br>A) secretion
Q22: Since pesticides affect humans in a manner
Q31: What conclusion did scientists likely draw from
Q32: Coral reefs are<br>A) shells of Mollusca that
Q42: Which part of this figure shows a
Q46: Which characteristic of vertebrates is associated with
Q49: In a certain type of nuclear reactor,
Q53: What is the digestive system microbiome?<br>A) all