Exhibit 9.5
The following questions are based on the description and spreadsheet below.
An analyst has identified 3 independent variables (X1, X2,X3) which might be used to predict Y. He has computed the regression equations using all of the variables and the results are summarized in the following table. 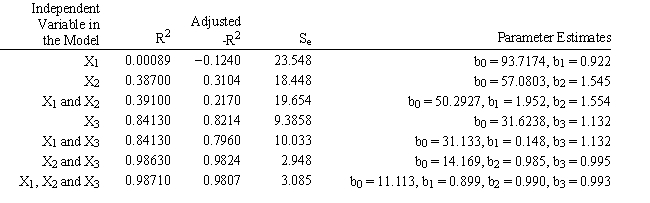
-Refer to Exhibit 9.5. Predict the mean value based on (X1, X2, X3) = (3, 32, 50). Use the best predictive model based on data from the table.
Definitions:
Q2: What function should be used for generating
Q8: How many arcs are required to make
Q24: A formulation has 20 variables and 8
Q28: Which of the following distributions can be
Q51: Using the information in Exhibit 12.3, what
Q51: A factory which ships items through the
Q58: A persistent upward or downward movement of
Q75: A company must invest in project 1
Q80: When the lines connecting the nodes in
Q96: The dependent variable <img src="https://d2lvgg3v3hfg70.cloudfront.net/TB2300/.jpg" alt="The dependent