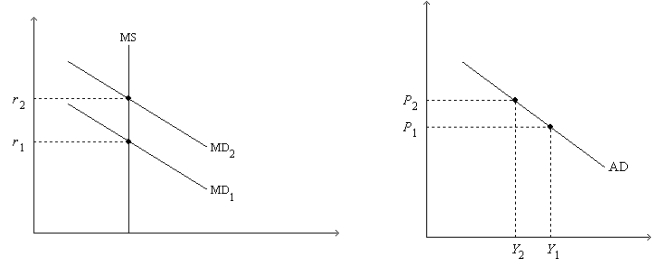
Figure 34-2. On the left-hand graph, MS represents the supply of money and MD represents the demand for money; on the right-hand graph, AD represents aggregate demand. The usual quantities are measured along the axes of both graphs.

-Refer to Figure 34-2. Assume the money market is always in equilibrium, and suppose r1 = 0.08; r2 = 0.12; Y1 = 13,000; Y2 = 10,000; P1 = 1.0; and P2 = 1.2. Which of the following statements is correct?
Definitions:
Rising Incomes
An economic condition where individuals or populations experience an increase in their disposable income, often leading to changes in spending habits and economic growth.
Cost of Lumber
The expense associated with purchasing wood used for construction and manufacturing, which can vary based on supply and demand.
Demand
The quantity of a good or service that consumers are willing and able to purchase at various price levels at a given point in time.
Supply
The total amount of a good or service available for purchase at any given price level within a defined market.
Q19: Which of the following would shift long-run
Q39: Refer to Figure 33-16. Suppose the economy
Q71: Which of the following is most important
Q116: Suppose the economy is in long-run equilibrium.
Q131: Suppose there was a large increase in
Q258: Which of the following is an example
Q365: An increase in the U.S. interest rate<br>A)
Q393: Other things the same, if the U.S.
Q452: Refer to U.S. Financial Crisis. U.S. net
Q506: Refer to Figure 34-5. A shift of