Multiple Choice
Table 3-2
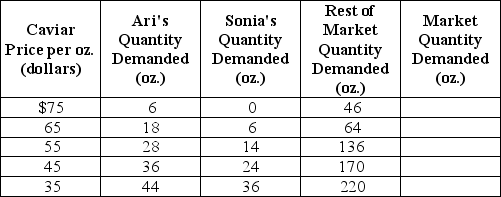
-Refer to Table 3-2.The table above shows the demand schedules for caviar of two individuals (Ari and Sonia) and the rest of the market.If the price of caviar falls from $45 to $35, the market quantity demanded would
Definitions:
Related Questions
Q49: What is the difference between an "increase
Q60: Refer to Figure 3-2.A decrease in the
Q63: In a report made to the U.S.Congress
Q94: Producer surplus is the difference between the
Q98: An increase in the equilibrium price for
Q132: Refer to Figure 3-2.A technological advancement would
Q179: Refer to Figure 4-19.The figure above illustrates
Q229: Refer to the Article Summary.The additional tax
Q257: The following equations represent the demand and
Q449: Refer to Figure 3-5.At a price of