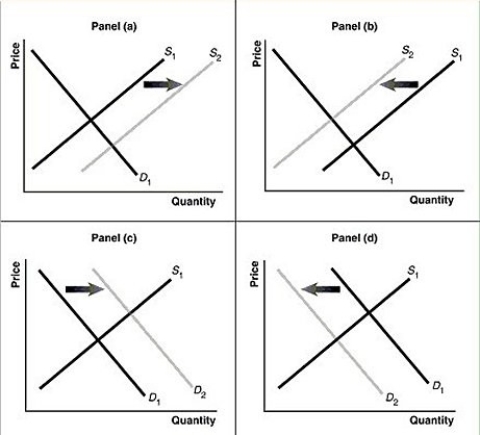
Figure 3-7

-Refer to Figure 3-7.Assume that the graphs in this figure represent the demand and supply curves for women's clothing.Which panel best describes what happens in this market when the wages of seamstresses rise?
Definitions:
Property Income
Income from the ownership of real property and financial holdings. It takes the form of profits, interest, dividends, and rents.
Personal Income
The total amount of income garnered by individuals from all sources before taxes.
Transfer Program
Government initiatives designed to redistribute income across different sectors of the population through mechanisms like welfare benefits or social security payments.
Federal Level
Pertaining to the national government, as opposed to state, local, or municipal levels, dealing with issues that affect the country as a whole.
Q12: If an increase in income leads to
Q36: Refer to Figure 4-16.Suppose the market is
Q101: Suppose that when the price of strawberries
Q166: "Because apples and oranges are substitutes,an increase
Q232: Refer to Figure 3-8.The graph in this
Q267: Refer to Figure 3-4.If the price is
Q331: Refer to Figure 2-6.If the economy is
Q392: If additional units of a good are
Q436: If the price of refillable butane lighters
Q464: Which of the following would cause the