The figure given below shows the revenue and cost curves of a monopolistically competitive firm. Figure 25.3 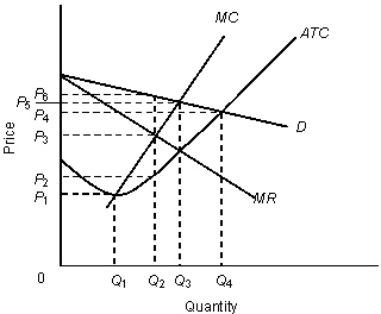 In the figure,
D: Demand curve
MR: Marginal revenue curve
MC: Marginal cost curve
ATC: Average total cost curve
Refer to Figure 25.3.A perfectly competitive outcome would exist at a price of _____ and an output level of _____.
Definitions:
Unique History
The distinctive and singular past or background of an individual, organization, place, or object that sets it apart from others.
Entry Barriers
Obstacles that make it difficult for new competitors to enter a market.
Capital Requirements
The minimum amount of capital a bank or financial institution must hold as required by financial regulators.
Economies Of Scale
Financial advantages gained by businesses from their operational size, wherein the cost for each unit of production typically falls as the scale expands.
Q18: With illegal immigration the unskilled labor supply
Q24: Which of the following is true of
Q33: The characteristic that distinguishes a perfectly competitive
Q34: The figure below shows the market equilibrium
Q39: The table given below shows the price,
Q42: Which of the following is not a
Q63: If the price of an ounce of
Q81: If a particular factor has a specific
Q95: In the case of positive externalities, too
Q122: Which of the following faces a horizontal