The following figures show the demand and cost curves of a perfectly competitive and a monopoly firm respectively. Figure 24.7 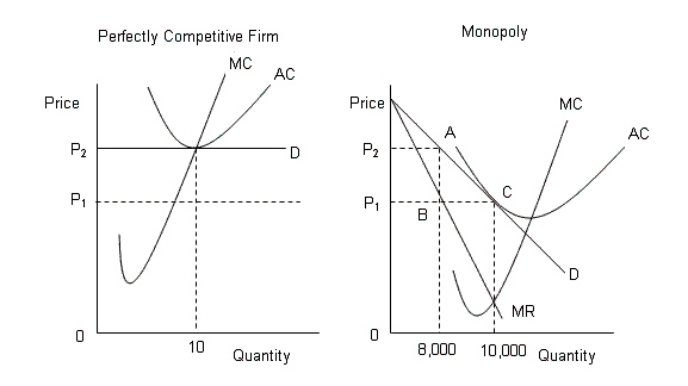 D: Average Revenue
AC: Average cost
MC: Marginal cost
MR: Marginal cost
According to Figure 24.7, which of the following statements is incorrect about the price P1?
Definitions:
Family Expectations
The beliefs or standards that family members have regarding the behavior, achievements, or roles of its members.
Society's Norms
The expected patterns of behavior and belief that are accepted and enforced by a group or society.
Property Rights
Legal rights to possess, use, and dispose of assets including real estate, personal property, and intellectual property.
Values Clarification
A process by which individuals reflect on, articulate, and align their personal values with their actions and decisions.
Q6: Why does network externality arise?<br>A)Each additional unit
Q22: The short-run equilibrium position for a firm
Q30: The figure given below shows the revenue
Q33: Consider an oligopoly that has two firms,
Q42: In the following figure, the first panel
Q50: Which of the following is true of
Q53: The Social Security tax structure in the
Q66: The table given below shows the total
Q106: Why is each firm in a monopolistically
Q134: Given a perfectly competitive market structure at