The figure given below shows the revenue and cost curves of a perfectly competitive firm. Figure 23.2 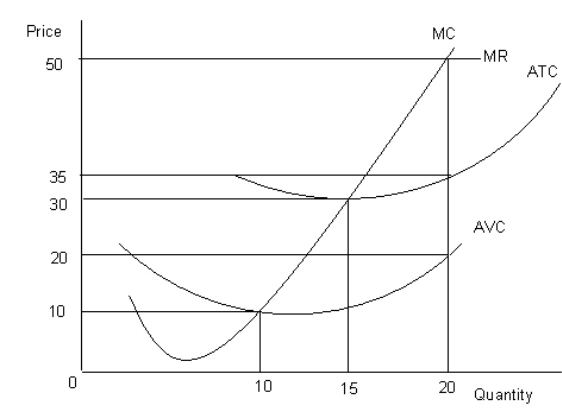 MC: Marginal cost curve
MR: Marginal revenue curve
ATC: Average-total-cost curve
AVC: Average-variable-cost curve
Refer to Figure 23.2.Compute the profit earned by the firm at the profit-maximizing level of output.
Definitions:
Broad Goals
General objectives that guide an organization or individual's actions without specifying detailed steps or strategies.
Broader Society
Pertains to the larger social system outside of smaller groups or communities, including cultural, economic, and structural dimensions.
Organizational Climate
Organizational climate represents shared perceptions of members regarding what the organization is like in terms of management policies and practices.
Organizational Culture
The shared values, beliefs, norms, and practices that shape the social and psychological environment of a business.
Q9: When practicing price discrimination, a firm can
Q11: Firms under perfect competition produce:<br>A)homogeneous products.<br>B)unique products.<br>C)either
Q17: A monopolist can charge whatever price it
Q38: Scenario 22.2 Consider a publicly held firm
Q46: Appreciation of the dollar means that now
Q57: An upward-sloping supply curve of Korean won
Q59: According to strategic trade policy, international trade
Q85: When a monopoly is regulated it is
Q89: According to economic theory, the difference between
Q125: The model of perfect competition best applies