The figure given below shows the revenue and cost curves of a perfectly competitive firm. Figure 23.2 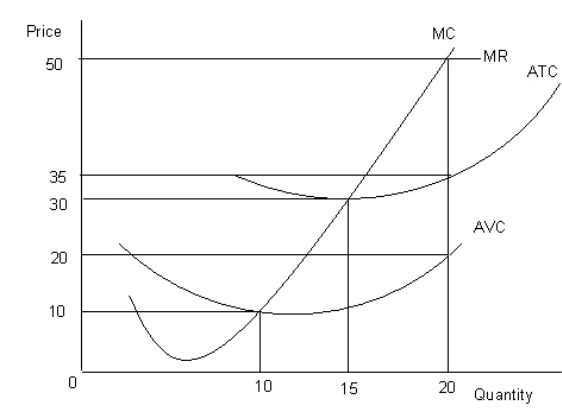 MC: Marginal cost curve
MR: Marginal revenue curve
ATC: Average-total-cost curve
AVC: Average-variable-cost curve
According to Figure 23.2, the break-even price of the firm is:
Definitions:
Q9: If a firm is a price taker,
Q23: The monopolistically competitive firm will charge a
Q43: Which of the following is an example
Q66: The long-run equilibrium price-output combination for a
Q73: The following figures show the demand and
Q82: The table below shows the payoff (profit)matrix
Q90: Which of the following would least likely
Q95: The following figure shows equilibrium at the
Q106: In order to reduce the possibility of
Q107: In a price-leadership oligopoly model, the oligopoly