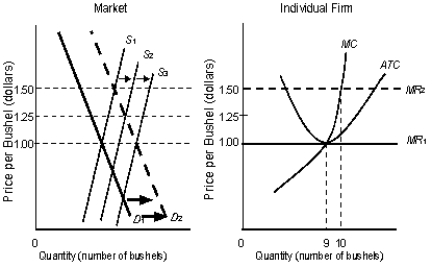
The following figure shows equilibrium at the industry and firm level.Figure 10.6
 In the figure,
S1, S2, S3 are the market supply curves.D1 and D2 are the market demand curves.MC is the marginal cost curve of the firm.MR1 and MR2 are the marginal revenue curves of the firm.ATC is the average-total-cost curve of the firm.
-Graphically, consumer surplus is the area:
Definitions:
Rent Expense
An expense account detailing the cost incurred for the use of rental property or equipment.
Fundamental Qualities
The essential attributes or characteristics that something possesses, which are crucial for its nature or function.
Useful Information
Information that is relevant, accurate, and timely, aiding individuals or organizations in making informed decisions.
Descriptive Statement
A written document that clearly describes the characteristics or details of an item or event.
Q8: When each additional resource adds increasing amounts
Q25: Suppose Atlas Publishing, a perfectly competitive firm,
Q25: The figure given below depicts the negatively
Q45: The world output is higher if the
Q47: A firm maximizes its profit at a
Q51: Wikipedia and other projects utilizing wiki technology,
Q61: The following graph shows the marginal revenue
Q73: Purchasing power parity exists when domestic currency:<br>A)maintains
Q94: Which of the following is not a
Q127: Suppose a U.S.firm buys a one-year U.K.bond